How Does a Resistance Level Work in Technical Analysis?

Resistance levels play a pivotal role in technical analysis, acting as invisible barriers that prevent asset prices from rising further. These levels reflect the market’s collective sentiment, where buyers hesitate, and sellers dominate. Understanding how resistance works helps traders navigate volatile markets, identifying key moments for potential reversals or breakouts. Make sure you learn about resistance level, technical analysis, and other investing concepts! Click here and connect with education firms to start with investment education!
The Science Behind Resistance: Price Action and Market Behavior
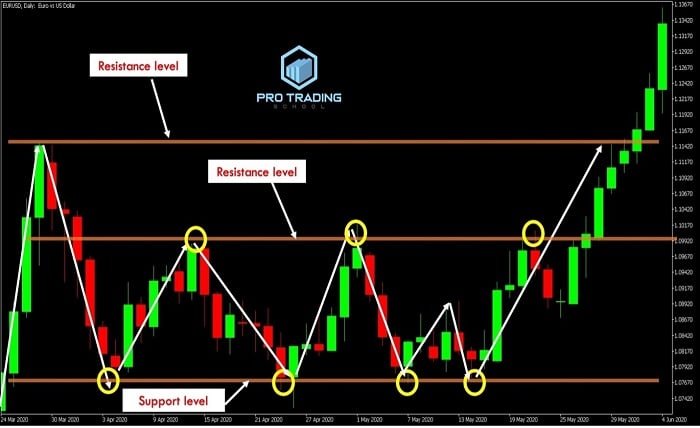
Resistance levels in technical analysis aren’t just arbitrary numbers; they represent key psychological thresholds where market participants repeatedly halt upward price movement.
This happens when buyers hit a “wall” of selling pressure, preventing the price from rising further. Essentially, resistance forms when the market hesitates to pay more for an asset, leading to repeated price rejections at similar levels.
When prices approach a resistance level, traders react differently based on their positions. Those who bought earlier may sell to lock in profits, which creates selling pressure.
Simultaneously, other traders may look to short the market, expecting a reversal. Together, these actions reinforce resistance at that price level. It’s a bit like hitting a ceiling, where sellers continuously overpower buyers.
A well-known example involves psychological price points like round numbers (e.g., $100), which tend to serve as stronger resistance levels. Why? Round numbers are memorable and have emotional significance for traders, making them key decision points in the market.
Moreover, fear and greed also drive behavior around these levels. Buyers might hesitate to push through resistance, fearing losses if prices reverse.
Sellers, on the other hand, feel emboldened, as the resistance level held strong in the past, reinforcing their decisions to sell at this point. Think of it like a tug-of-war, where market sentiment shifts based on who has the upper hand at key levels.
Finally, resistance isn’t static. As market sentiment shifts, previously strong levels can become weaker or even flip into support levels. This dynamic nature of resistance highlights the ongoing battle between buyers and sellers, shaping market behavior.
Key Indicators and Tools to Identify Resistance Levels
Identifying resistance levels is a crucial part of technical analysis, and several tools and indicators are used for this purpose. Some of the most reliable include moving averages, Fibonacci retracement, and trendlines.
- Moving averages: These are dynamic indicators that track the average price of an asset over a specific period. They act as both support and resistance depending on market direction. For instance, the 50-day or 200-day moving averages are common resistance levels. When the price approaches these averages, it often struggles to break through, as many traders watch these key levels for entry or exit points.
- Fibonacci retracement: This tool is based on the idea that markets retrace a predictable portion of a move before continuing in the same direction. Traders use the Fibonacci levels (e.g., 38.2%, 50%, 61.8%) to spot potential resistance. If the price bounces off one of these levels, it’s a signal that resistance is holding.
- Trendlines: Drawing trendlines by connecting the highs of price movement during a downtrend can help pinpoint areas of resistance. The more touchpoints a trendline has, the stronger the resistance it represents. As price action consistently respects these lines, traders use them to set stop-losses or identify breakout opportunities.
Confirming resistance levels often involves candlestick patterns and volume analysis. For example, if a stock approaches resistance with low trading volume, it suggests a lack of conviction, making a breakout less likely. Conversely, high volume near resistance may indicate strong buying pressure, suggesting a possible breakout.
Conclusion:
Mastering resistance levels offers traders a significant advantage, providing clarity in unpredictable market movements. By utilizing tools like moving averages and Fibonacci retracements, traders can anticipate price behavior and make more informed decisions. For anyone looking to enhance their strategy, learning resistance dynamics is key to long-term success in technical trading


