
CAGR vs Returns: Use a Calculator Before You Trust Any Trading App’s Claims
Compound Annual Growth Rate (CAGR) and absolute returns are two ways of looking at investment performance. At first glance, the numbers shown on trading apps can look remarkable. However, what really matters is how those numbers are calculated. Without that clarity, it’s easy to misread performance and form expectations that may not be sustained in practice.
What are Absolute Returns?
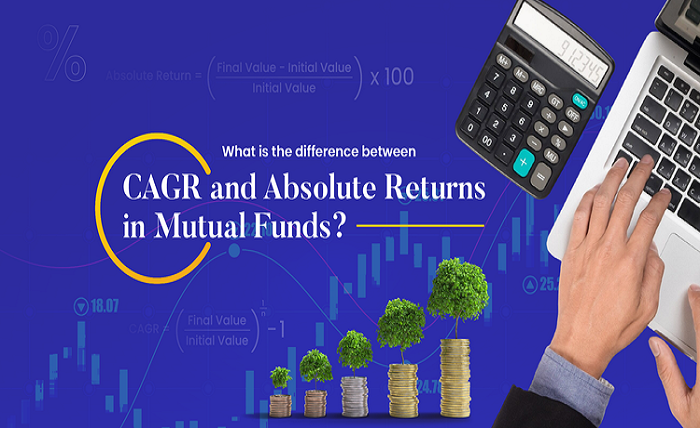
The easiest method of measuring profit is through absolute return. It depicts the overall increase in your investment without going into the duration of time.
So, if ₹1,00,000 becomes ₹1,60,000, that’s a 60% return. Straightforward. But here’s where it gets tricky, this figure doesn’t tell you whether that growth happened in one year or over five years.
Practically, such a difference counts a lot. A 60% return in a year is an indicator of good performance. The equivalent payback in five years is much more subdued. Absolute returns, however, may offer only a superficial impression, while failing to capture the underlying complexities and key details.
What is CAGR (Compound Annual Growth Rate)?
CAGR tells you the average annual growth rate of your investment, assuming the returns are reinvested each year.
Basically, it answers a more useful question: “At what steady rate did this investment grow every year?”
Take the same example: ₹1,00,000 growing to ₹1,60,000 over five years. The CAGR comes out to roughly 9.86% per year. That number gives you a clearer sense of how the investment performed over time.
Worth noting, CAGR smooths out the ups and downs. That makes it easier to compare different investments.
Why the Difference Matters
This is where many investors are frequently not prepared. Trading apps often highlight absolute returns because they seem higher and more appealing.
You might see something like “100% return” prominently displayed. It may appear suitable, but only until you check the time frame. If that return took seven or eight years, the annual growth rate is actually quite moderate.
Many times, this detail is either less visible or not immediately considered by users. And that’s where interpretation can go wrong. Without adjusting for time, returns can appear more attractive than they really are.
Using a CAGR Calculator for Clarity
This is where a CAGR calculator becomes useful. It helps translate total returns into an annual growth rate, which is far easier to evaluate.
All you need are three inputs:
- Initial investment
- Final value
- Time period
Once you have that, the calculator does the rest.
In practice, this step can change how you view an investment. A return that initially looks strong may turn out to be average when annualised. On the other hand, a moderate total return over a short period might actually reflect solid performance.
It’s a small step, but it brings a lot more clarity.
Practical Comparison: CAGR vs Absolute Return
Let’s look at a simple comparison.
- Investment A grows from ₹1,00,000 to ₹1,80,000 in 3 years
- Investment B grows from ₹1,00,000 to ₹1,80,000 in 6 years
Both show an 80% return. On paper, they look identical.
But in reality, Investment A has grown much faster. Its CAGR is significantly higher because it reached the same value in less time.
This is exactly why CAGR matters; it captures efficiency, not just the outcome.
When to Use Each Measure
Absolute return still has its place. It works well when you’re looking at short-term results or when the time period is fixed and clearly understood.
CAGR, however, is more useful for long-term investing. It helps you compare different options, assess consistency, and understand how compounding is working in your favour.
In most real-world scenarios, investors look at both but rely more on CAGR when making decisions.
Evaluating Trading App Claims
When you come across return claims on an online trading app, it is important to examine the matter more closely before forming a conclusion.
Check what kind of return is being shown. Look at the time period. If it’s not immediately clear, that’s already a signal to be cautious.
Then, you can easily calculate through a CAGR calculator. It doesn’t take long, and it gives you a much clearer picture.
Basically, this approach redirects attention away from just the key figures to actual performance.
Conclusion
CAGR and absolute return might appear to be similar, but they provide completely different perspectives about investment performance. Absolute return displays total growth, and CAGR fills the gaps by giving returns in the form of a yearly rate. Practically, most trading applications emphasise absolute returns since they seem more substantial, yet these numbers may be inaccurate. A CAGR calculator can fill this gap by transforming returns into a standard format that is simpler to analyse and compare. To any investor, this distinction is not only helpful but also critical to interpreting claims and developing a more accurate representation of performance.